Abstract
Social relationships are a core infrastructure for learning, yet we still know little about which types and conditions of ties make it work. We study 855 elementary-school students across 14 public schools in Chile, spread over 45 classrooms and two consecutive semesters.
We map cooperation relationships using a non-anonymous social dilemma between peers, implemented synchronously in each classroom on networked tablets with a friendly user interface. From those decisions we reconstruct a directed cooperation network per classroom and compute, at the student level, indicators of incoming, outgoing, reciprocal cooperation, and social status.
Using OLS regressions with class-group fixed effects we find a positive and significant association between reciprocity and academic performance, robust to individual controls. Using a difference-in-differences design between semesters we identify the effect: higher reciprocity produces a differential GPA improvement. The effect is heterogeneous and considerably stronger for the top 20% of reciprocity.
How the study works
Step 1 — The question
We do not compare levels of performance — we compare changes. The question is trajectorial: within the same classroom, who improves more between the first and the second semester — students embedded in reciprocal cooperative relationships or those who are not?
It is a deliberately narrow question. It lets us use each student as their own control over time and each classroom as its own control across space, which translates cleanly into a difference-in-differences design.
Step 2 — The measurement: a non-anonymous cooperation game
Instead of asking who is friends with whom, we observe how they decide. Every student played a non-anonymous social dilemma simultaneously on a tablet: you know who you are playing with, and they know it is you — so each decision carries real social weight.
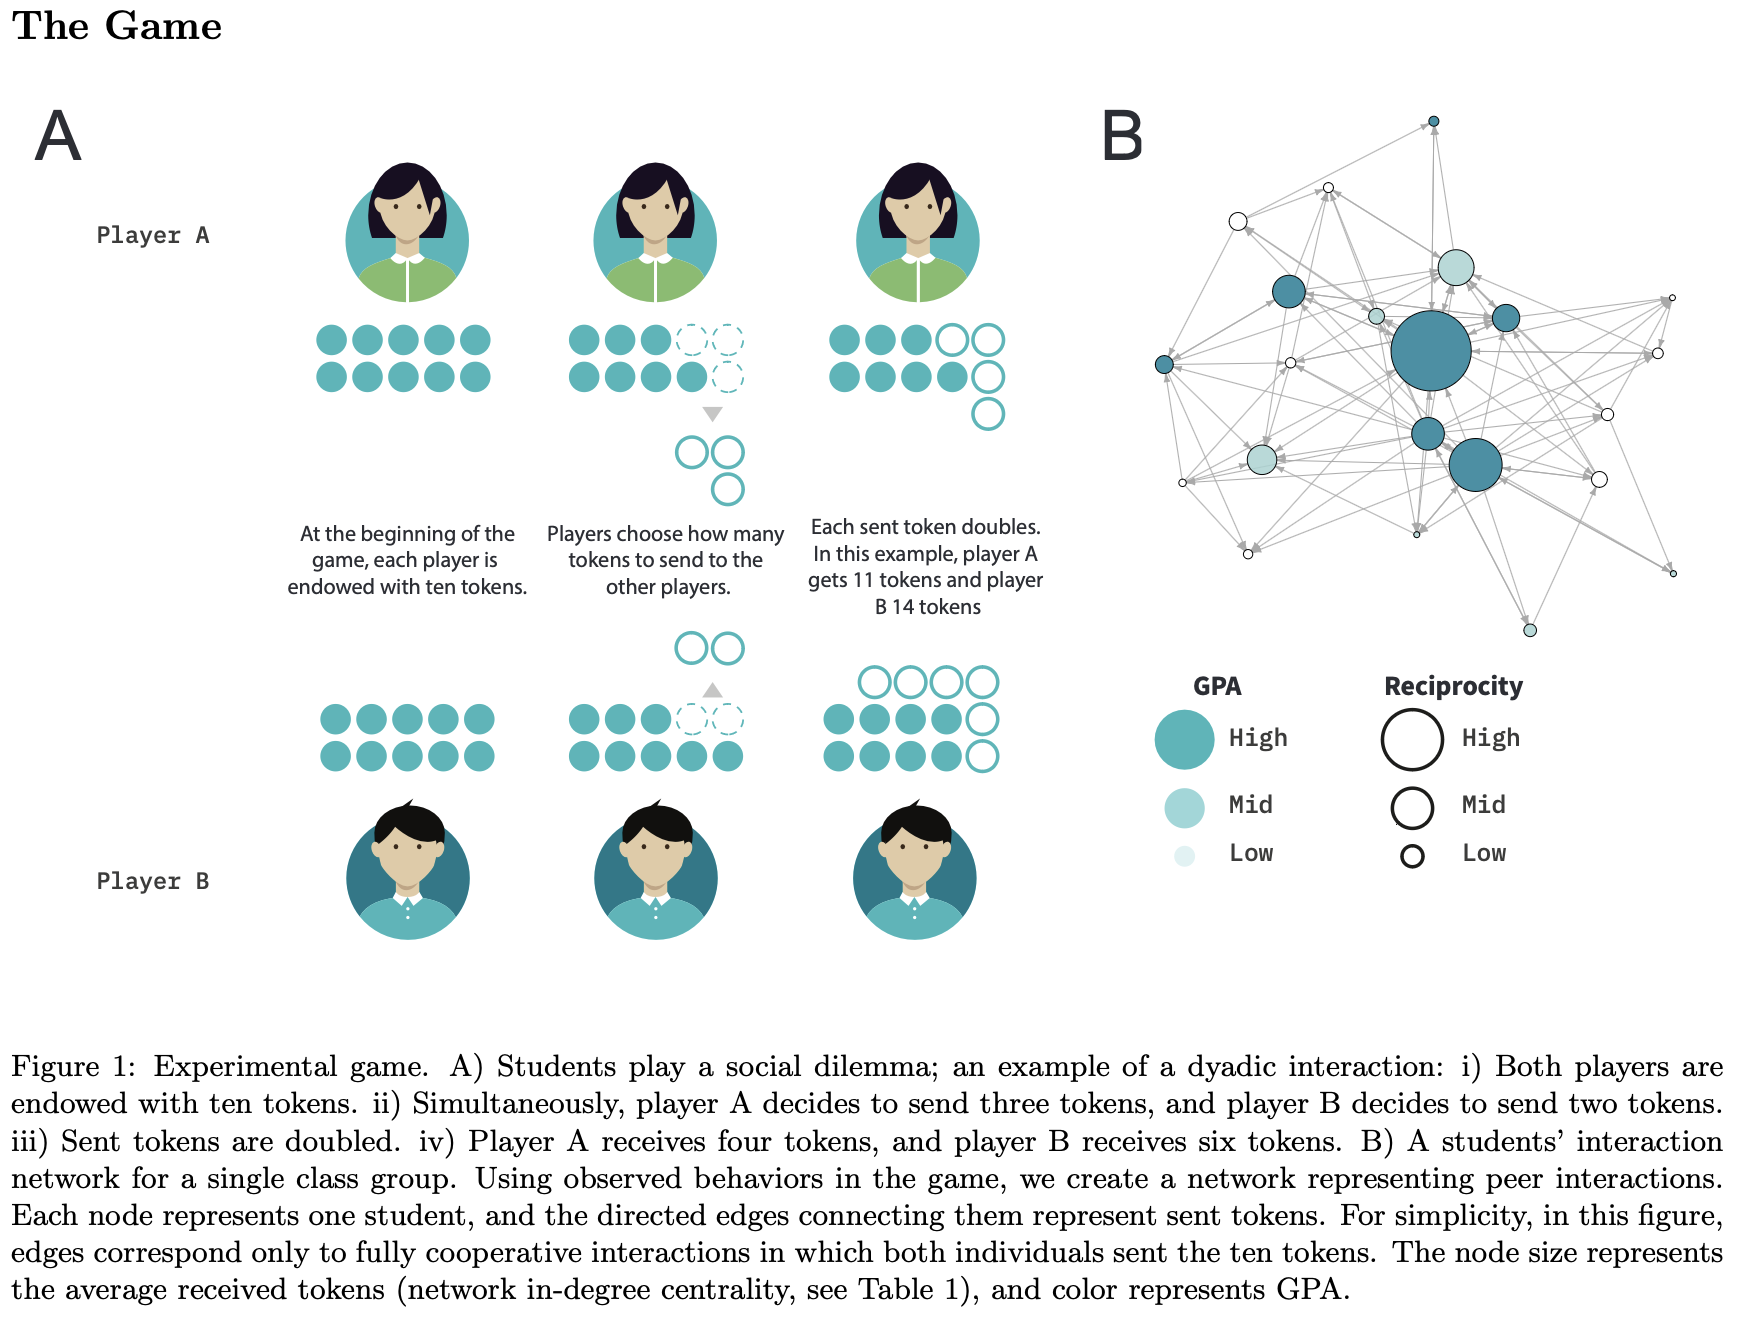
Each student receives 10 tokens and decides how many to send to each named classmate. Tokens received are doubled for the receiver. It is a low-cost, high-relational-payoff decision: an operational measure of willingness to cooperate with a specific peer.
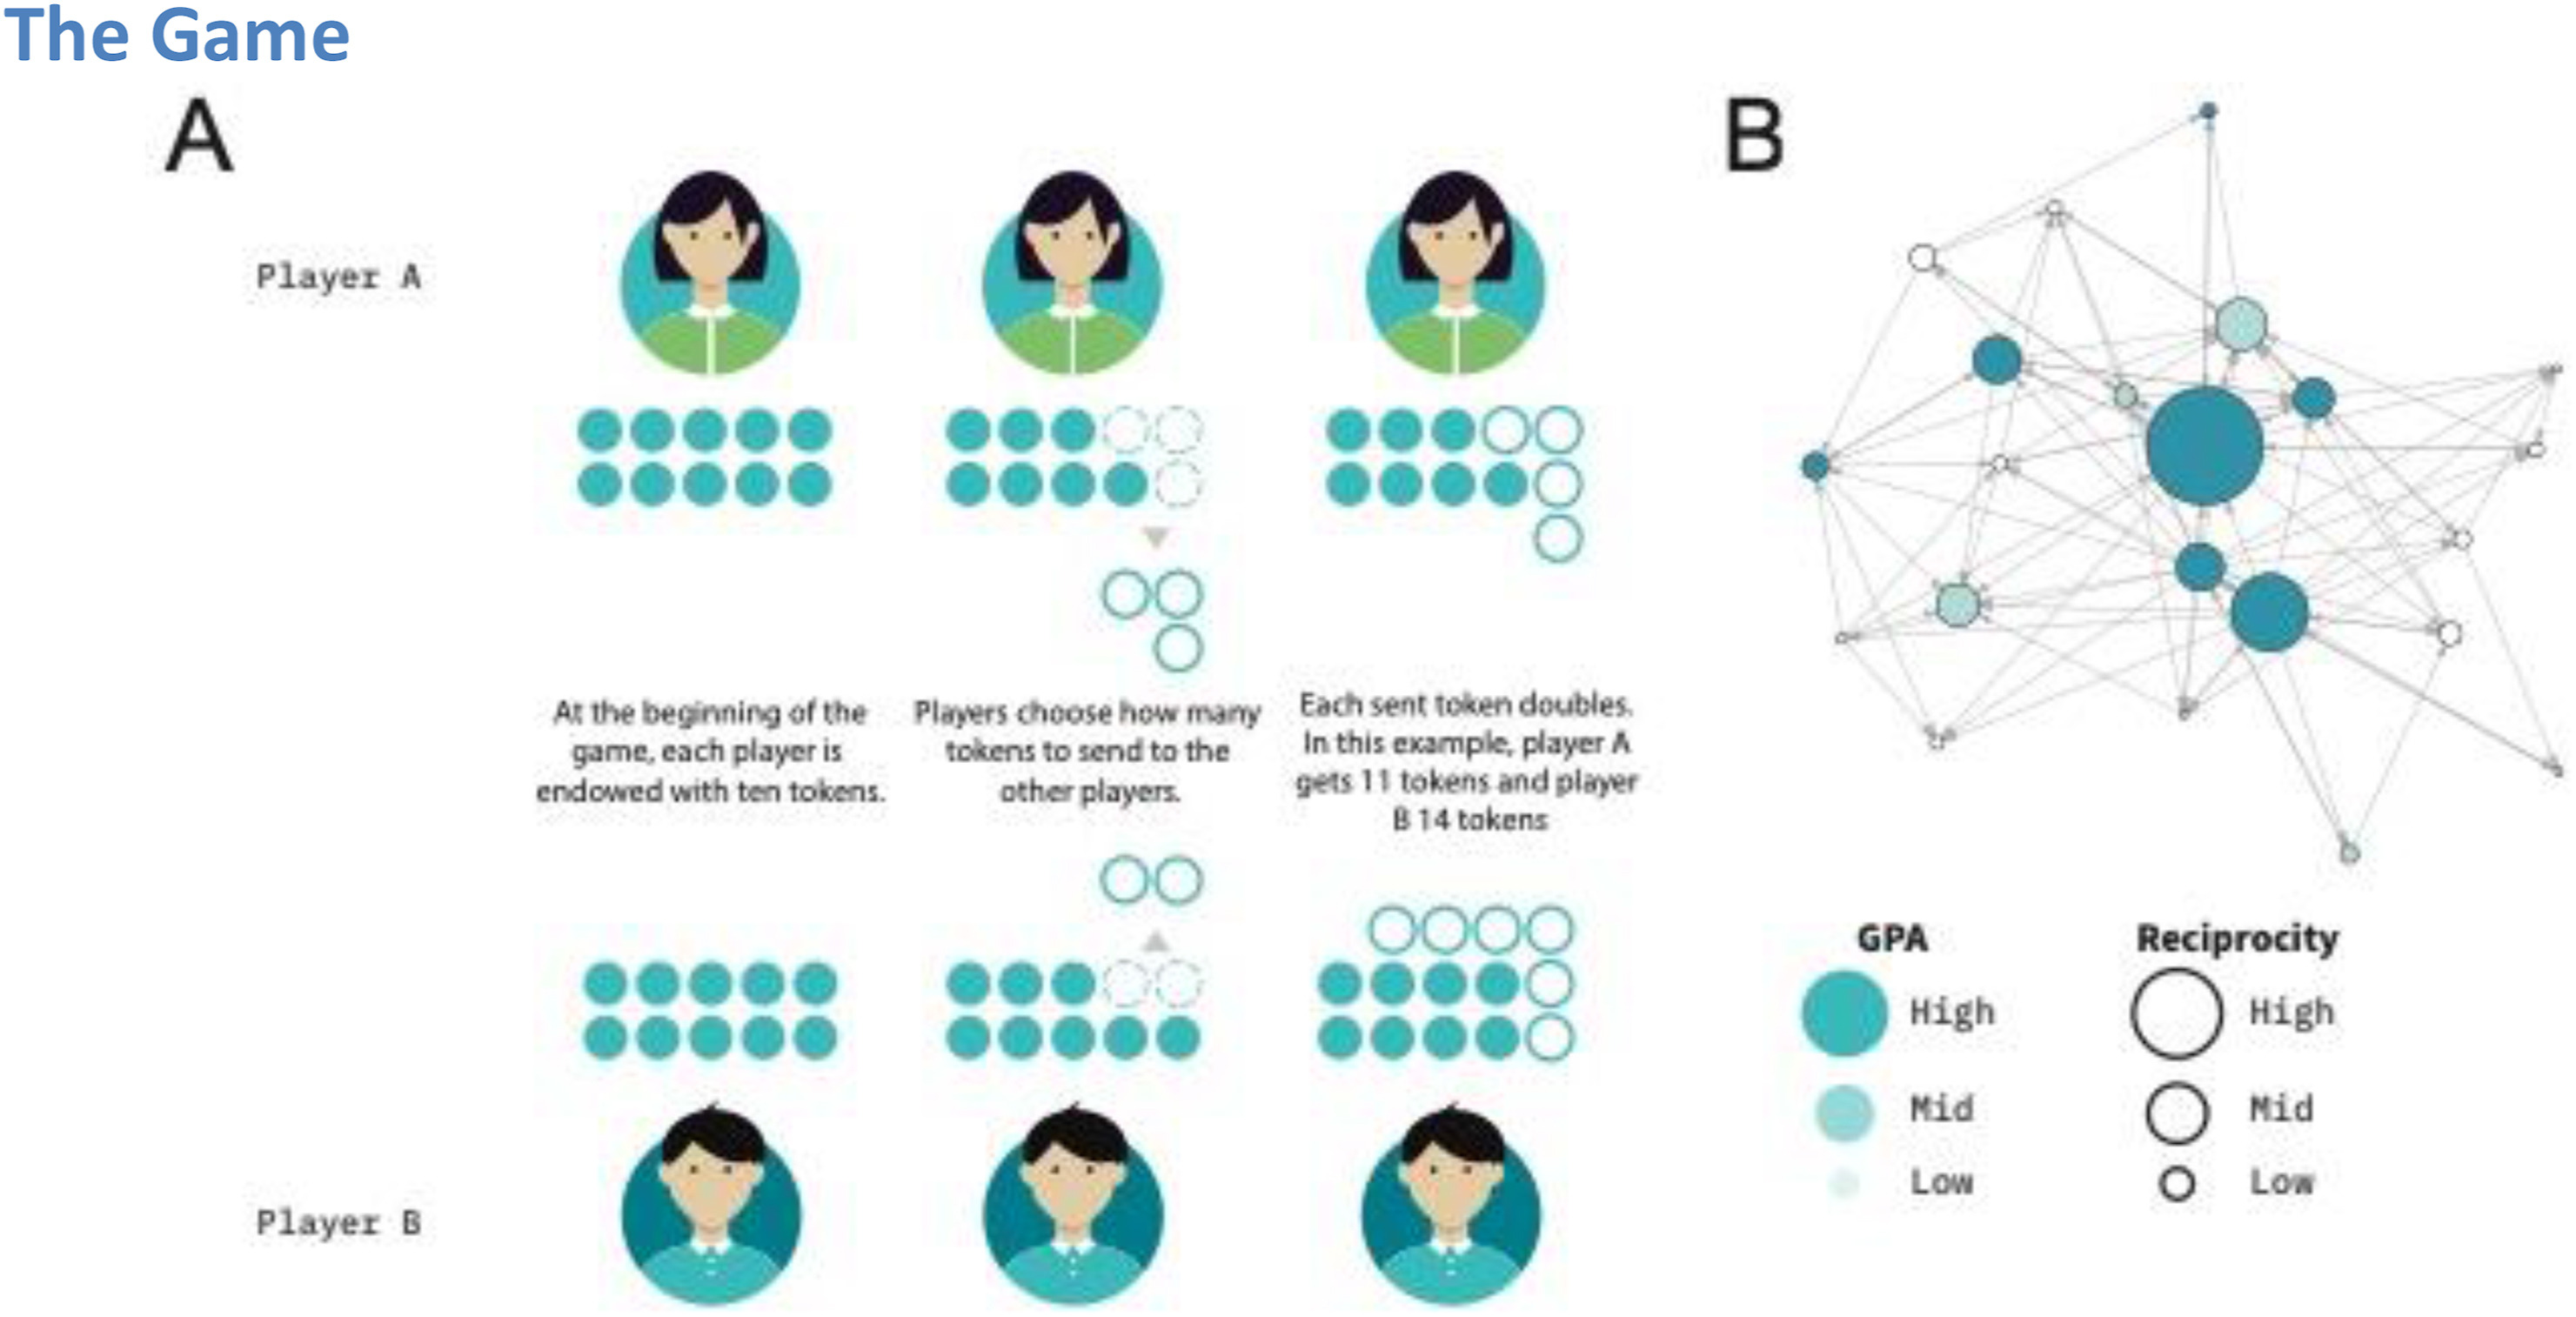
(A) The cooperation game: each student starts with 10 tokens and decides how many to send to each classmate. Sent tokens are doubled. (B) Example classroom network: nodes are students, edges are cooperative interactions. Node size is proportional to reciprocity; color, to GPA. Larger, darker nodes — more reciprocal, higher-performing students — cluster together.
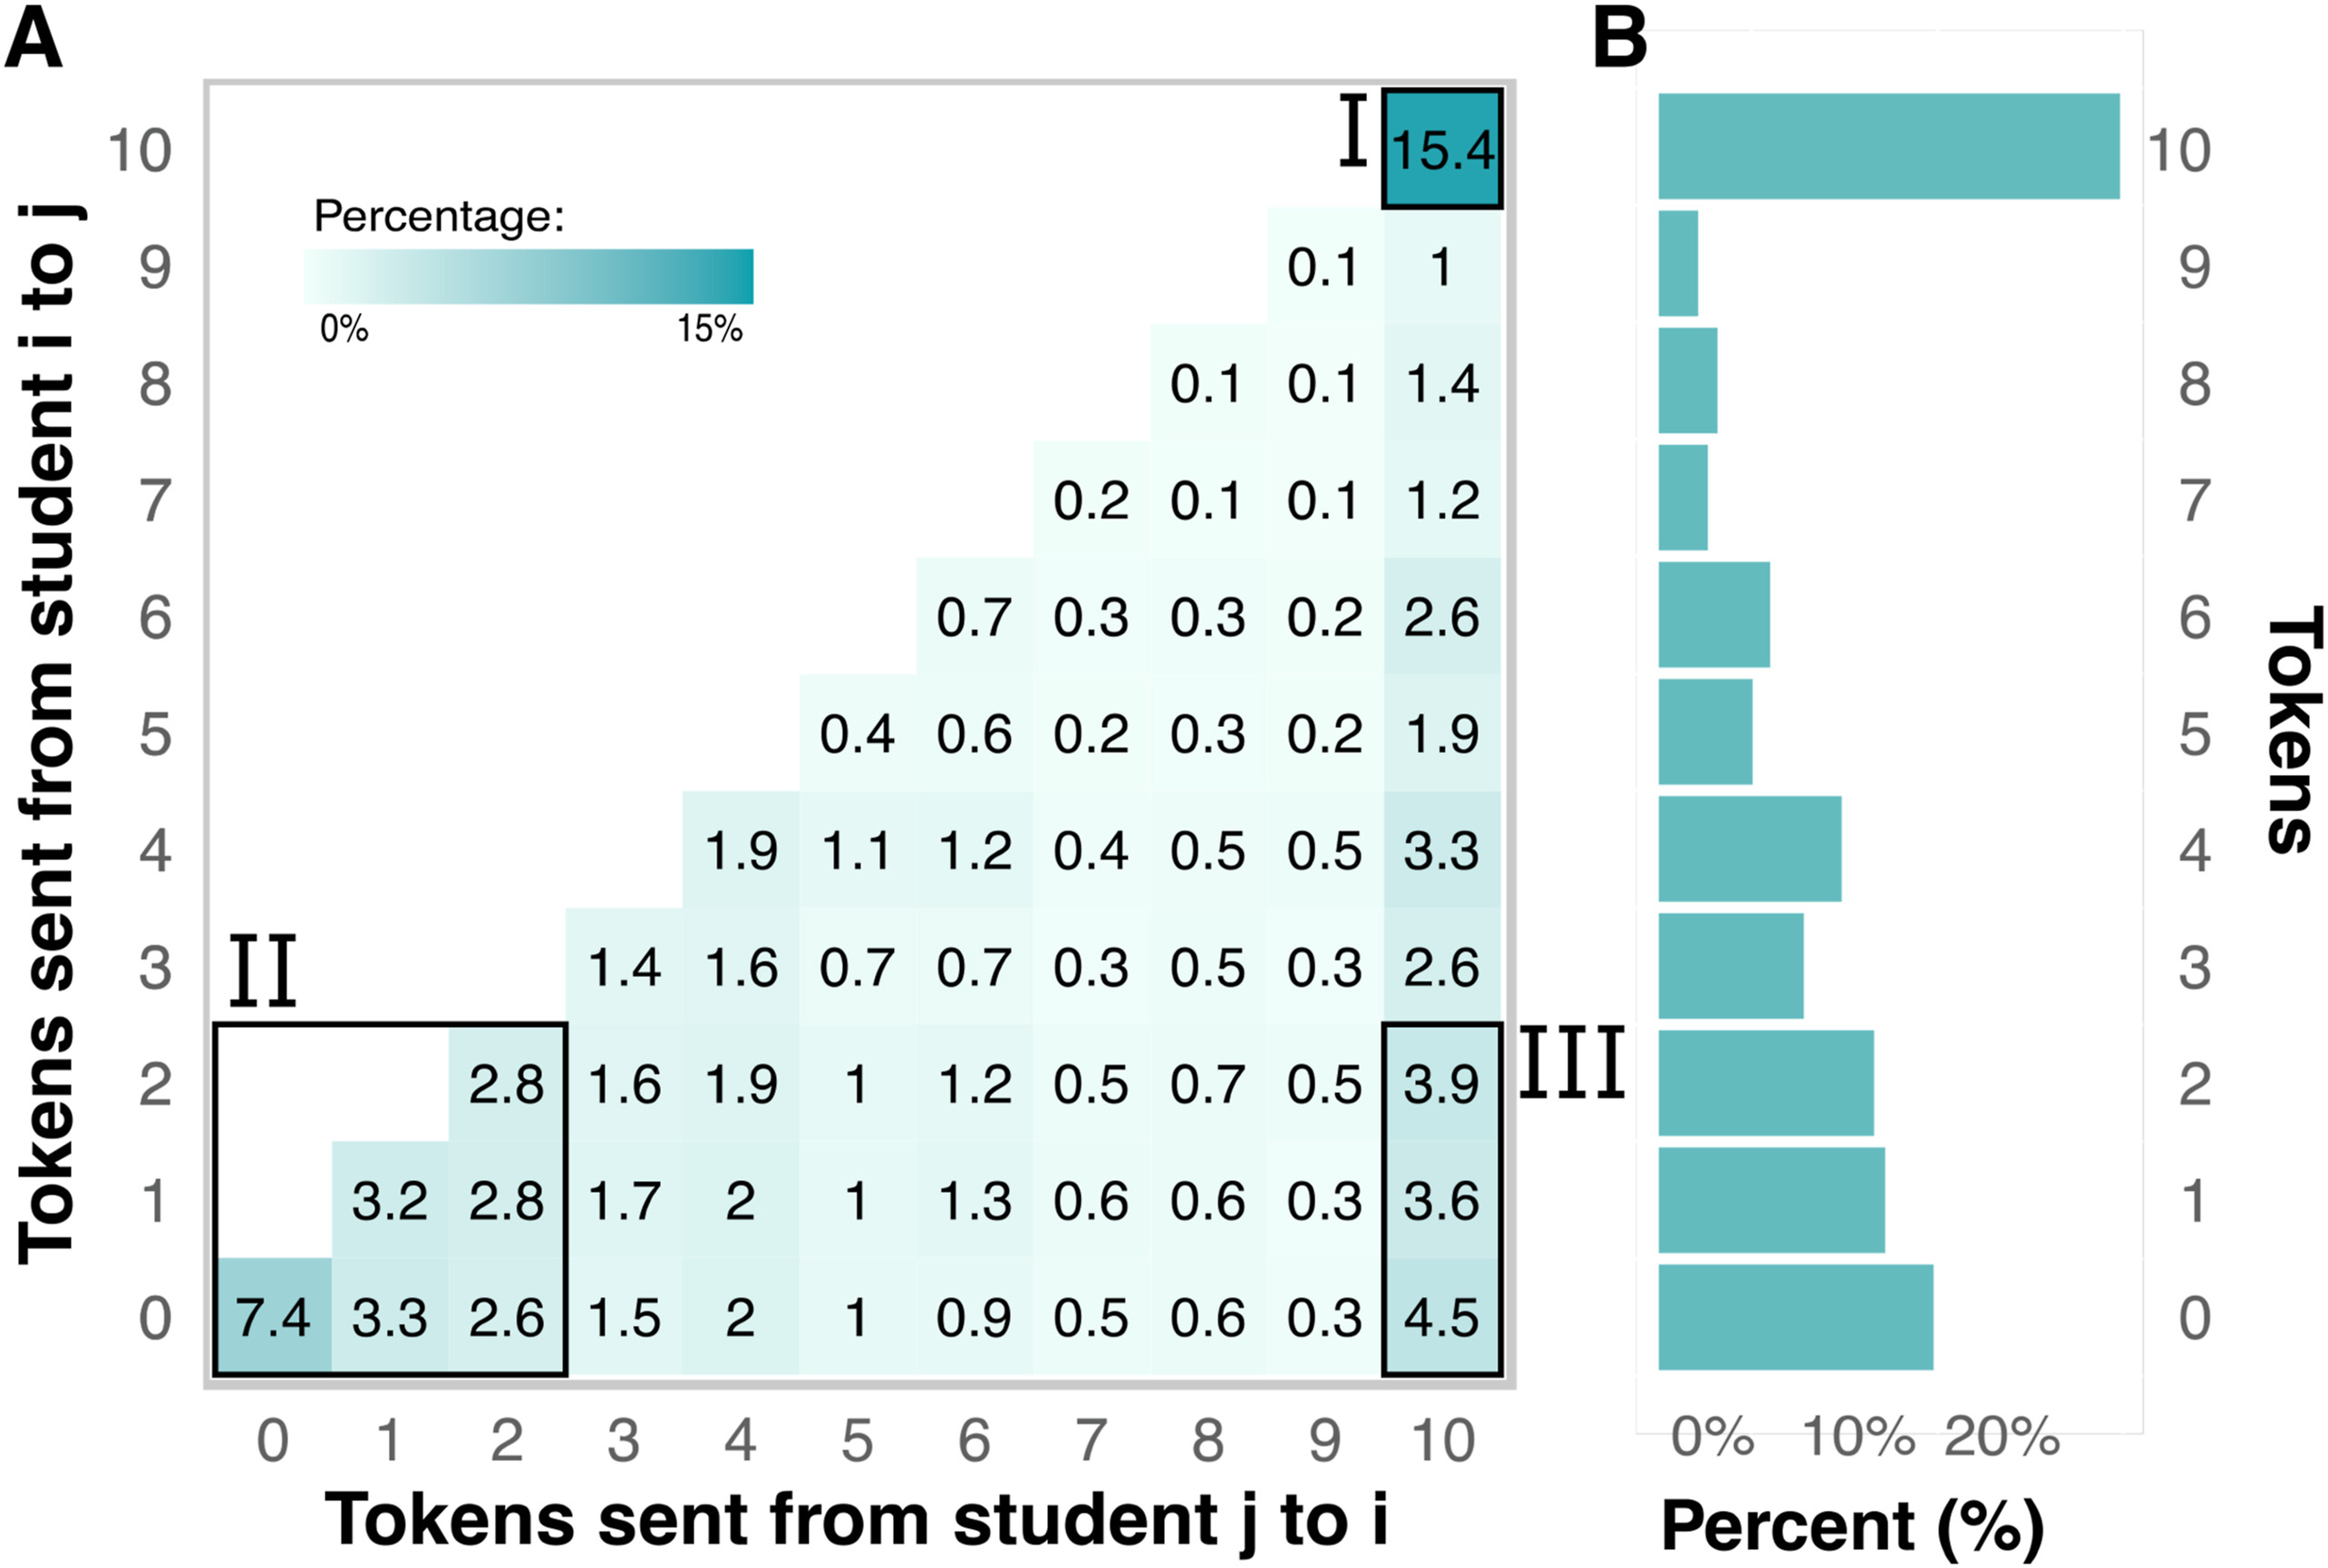
Distribution of tokens sent. Most students adopt extreme strategies: fully cooperative (10) or non-cooperative (0). About 12% of all interactions were fully cooperative.
Step 3 — Every choice leaves a relational trace
Aggregated, individual choices reconstruct a directed cooperation network per classroom. The classroom stops being a black box: it becomes an observable object, where every edge has direction, weight, and a named recipient.
In total, around 17,000 dyadic decisions across 45 local networks that share the same format and can therefore be pooled in a student-level analysis with class-group fixed effects.
Step 4 — From the network to quantitative indicators
We translate the network into four student-level indicators, capturing different dimensions of position in the classroom structure:
- Average in-degree — how much cooperation a student receives on average.
- Average out-degree — how much they send.
- Reciprocated weight (Rᵢ) — the core variable: for each pair, the reciprocated weight is the minimum of what A sent to B and what B sent to A; Rᵢ averages this over the student’s ties.
- PageRank — social status, accounting for the status of those who cooperate with the student.
The separation is deliberate: we want to rule out that the effect we will see comes from receiving a lot, sending a lot, or being popular. The specific hypothesis is that mutuality of the tie matters, not its volume or its prestige.
Step 5 — Causal design: difference-in-differences across semesters
A correlation between reciprocity and GPA could be selection: maybe higher-performing students happen to form better reciprocal ties. To address this we use a difference-in-differences design between two consecutive semesters, with individual fixed effects absorbing everything time-invariant at the student level — talent, personality, household income, cultural capital — and class-group fixed effects absorbing everything shared at the classroom level.
The operational idea: for each student we compare their GPA change between semesters as a function of their reciprocity at the start of the year, and then compare those changes across students within the same classroom. The DiD estimator is δ = Δ high reciprocity − Δ low reciprocity.
Key findings
Finding 1 — Reciprocity predicts higher GPA above and beyond other network dimensions
Using OLS with class-group fixed effects, a 1-SD increase in reciprocated cooperation is associated with +0.094 GPA points (Chile’s 1–7 scale), after controlling for prior GPA, attendance, parental education, sex, and social rank.
For context: the average GPA drop between the two semesters studied was 0.080 points. The reciprocity effect (0.094) is 117% of that typical decline — large enough to offset the usual between-semester dip. The four network measures together explain 18.3% of within-classroom variance; reciprocity alone, 5.4%.
The result holds after controlling for individual cooperative dispositions — how much a student sends on average — and social status (PageRank). It is not being cooperative, nor being popular: it is the mutuality of the tie.
Finding 2 — Causal identification: DiD across semesters
In the difference-in-differences design the estimator is δ = 0.039* (SE = 0.012, p < 0.01)**. Students with more reciprocal relationships at the start of the year improved their GPA more in the following semester than comparable peers in the same classroom with fewer reciprocal ties.
The DiD effect is on the same order as — if anything slightly larger than — the associative estimate. Controlling for unobservables strengthens rather than erodes the result.
DiD visualization. Teal line: trajectory of the high-reciprocity group (steeper between semesters). Beige line: low-reciprocity group. The orange bracket at the end measures the DiD effect = Δ high − Δ low, with β = 0.039*** in the continuous specification and +0.10 GPA points for the top 20%.
Finding 3 — The effect is heterogeneous and concentrated in the top 20%
The effect is not uniform: it is concentrated at the top of the reciprocity distribution. Among students in the top 20% of reciprocity within their classroom, the effect rises to +0.10 GPA points* (SE = 0.034)**, about 2.5× the average effect. For lower-reciprocity students it is smaller and less precisely estimated.
The pattern suggests a threshold or reinforcement dynamic: students deeply embedded in mutually cooperative relationships get the most learning benefit, likely via richer peer-to-peer knowledge exchange and stronger social support.
Extension: from the classroom to other organizations
The methodological pipeline is portable.
The design is replicable in work teams, communities of practice, internal innovation programs, academic mentoring networks and, more generally, in any organization where reciprocal cooperation is part of the infrastructure of the product. The practical promise: interventions that strengthen reciprocal ties could lift performance not by changing the individual but by changing the structure in which the individual decides.
Keywords
Social networks · Academic performance · Reciprocity · Experimental game theory · Peer interaction · Cooperation · Primary education · Chile · Difference-in-differences
- Posted on:
- December 1, 2022
- Length:
- 8 minute read, 1601 words
- Categories:
- article